Note: Access requires a Price Transparency license assigned to your account. If you see an "Insufficient Permissions" message after signing in, contact Gigasheet to ensure a license has been assigned to your account.
This guide walks you through setting up your account, connecting your data, and exploring rates on the map. Follow the steps in order.
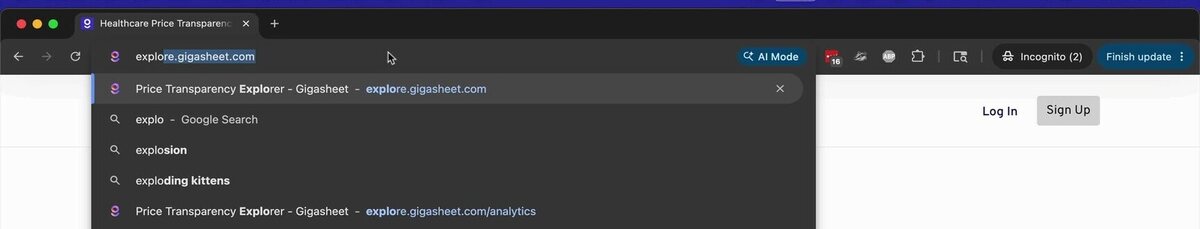
1 Open Gigasheet Explore
In your browser, go to explore.gigasheet.com to access the price transparency, exploration tools, and analytics.
2 Log in to your account
When prompted, log in to your Gigasheet account using your credentials.

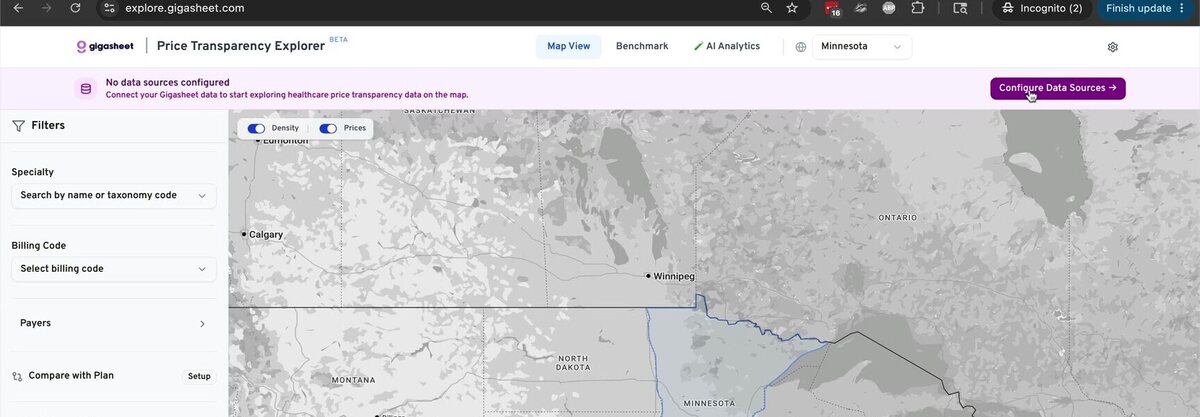
3 Configure your data sources
After logging in, you will see a map of the United States with a Configure Data Sources banner at the top. Click the pink button on the right to begin.
4 Add your shared sheet
On the Settings page, scroll to the bottom. Under Data Sources, click the pink glowing Add Sheet button.

5 Select the sheet and assign states
Select the sheet that has been shared with you. If your data is tied to a specific state, choose it from the state dropdown. For national datasets or data spanning multiple states, select multiple states at the top of the list.
6 Confirm the connection
You should automatically see a green checkbox and a Connected status. If you do not, click Revalidate All, or click Refresh and try again if you hit any errors.

7 Return to the map
Once you see the green checkmark and Connected status, click the Back button at the top left to return to the map. The map will zoom to your selected state. If you have multiple sheets mapped, you can switch states from the top of the screen.
8 Choose a specialty
To get started in the map view, select a specialty included in your dataset. The list shows all available taxonomy codes, not only the ones in your sheet, so some may return no data if your dataset is limited.

9 Pick a billing code
After selecting a specialty, you will see a list of highly utilized billing codes. These are shortcuts you can click to search for rates related to those codes. You can also type any billing code you want into the dropdown.

10 Example: office visit 99214
Here we have selected the typical office visit code 99214. The map and filters will use this code once applied.

11 Refine with filters and Smart Rate
You can filter by payers or apply advanced filters for finer control. Smart Rate is enabled by default and removes outliers for professional CPT codes. If you are looking at MS-DRGs or other codes like HCPCS, you may want to uncheck this box.

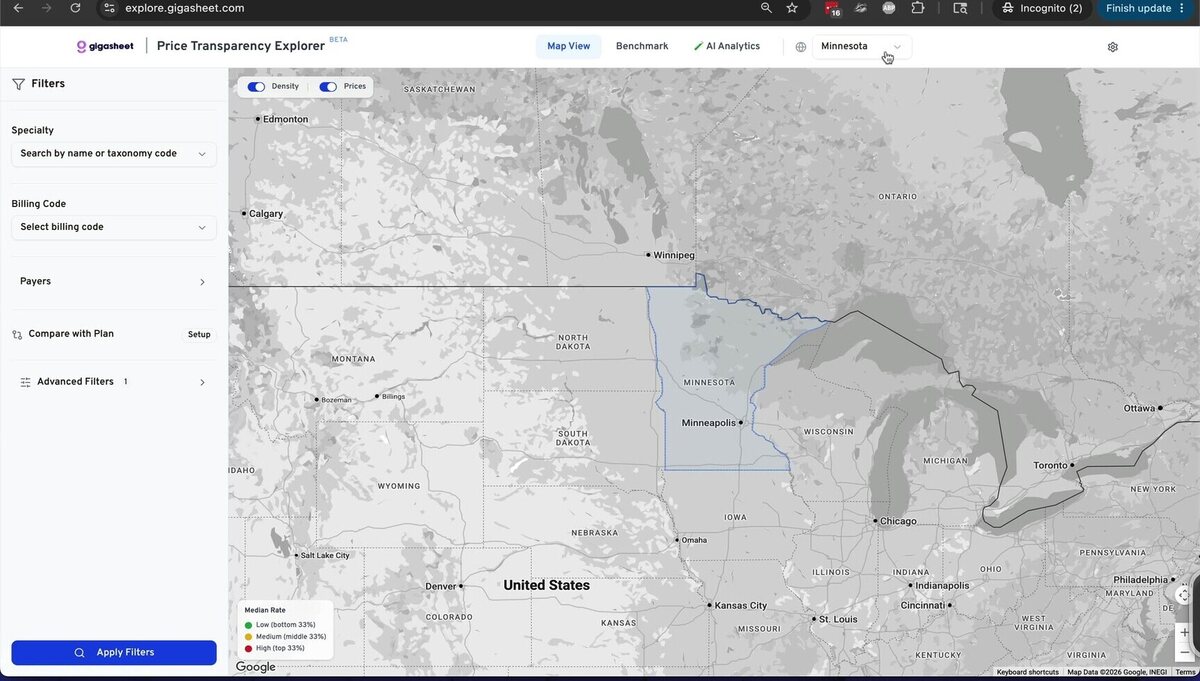
12 Apply filters and read the map
Click Apply Filters. The map fetches data for your selected geography, specialty, and billing codes. Markers represent the median rate for that billing code and specialty in each ZIP code.

13 Toggle provider density
Turn off the Prices option to color ZIP codes by provider density. Pink or red ZIP codes have a high density of providers; blue ZIP codes have a low density.

14 Drill into a ZIP code
Click any marker to drill down and see the providers and median rates for that ZIP code. Here you'll see the provider's median rate, plus how it compares to the Medicare rate on the Physician Fee Schedule.

15 Deep dive into Gigasheet
Click the blue Deep Dive in Gigasheet button to open all of the underlying data.

16 View the underlying data
The spreadsheet view opens pre-filtered to the data you were viewing on the map. Here you can modify the filters and adjust which data is visible in the sheet.

That is how you get started with the Gigasheet Price Transparency Tool. If you have questions, reach out to support@gigasheet.com at any time.
Column Reference
The Explorer automatically detects which columns in your sheet correspond to fields like NPI, billing code, payer, price, ZIP code, and specialty. If auto-detection does not produce correct results, you can manually map columns in the Settings → Data Sources section.
| Field | Description |
|---|---|
| NPI | National Provider Identifier (10-digit number) |
| Provider Name | Name of the billing provider or organization |
| Billing Code | CPT, HCPCS, or DRG code for the service |
| Payer | Insurance company or plan name |
| Negotiated Rate | The dollar amount negotiated between payer and provider |
| ZIP Code | Provider's service location ZIP code |
| Specialty / Taxonomy | Provider specialty taxonomy code |
| Place of Service | CMS place of service code (e.g., 22 = Outpatient Hospital) |
| Smart Rate | Optional flag indicating a "smart" or preferred rate in your dataset |
| Medicare % | Optional column expressing the rate as a percentage of the Medicare fee schedule |
Was this article helpful?
That’s Great!
Thank you for your feedback
Sorry! We couldn't be helpful
Thank you for your feedback
Feedback sent
We appreciate your effort and will try to fix the article